PM Training ROI: How to Measure and Defend the Business Case to Your CFO
PM training ROI is one of the hardest budget conversations in L&D. Two metrics change that conversation. They are already in your CFO's vocabulary. Here's how to use them.
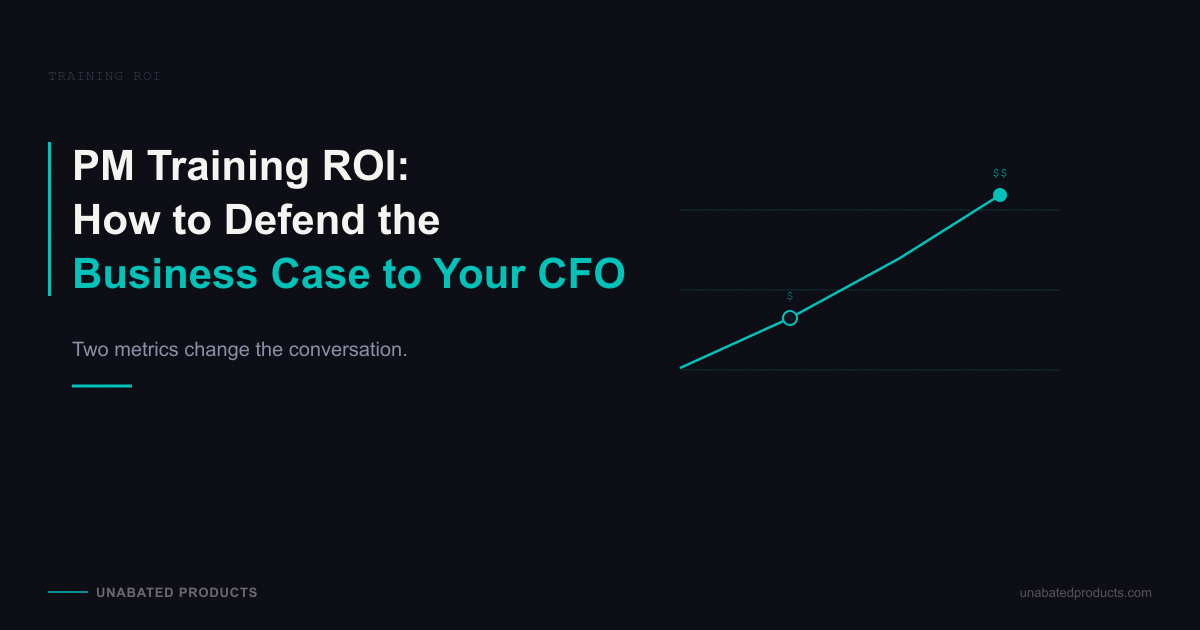
PM training ROI is one of the hardest budget conversations in L&D. The benefits are real but they are slow and diffuse. By the time you can connect training investment to a business outcome, you are in next year's budget cycle trying to justify a program you ran six months ago.
Two metrics change that conversation. They are not new metrics. They are already in your CFO's vocabulary.
◆
Why Standard Training ROI Metrics Don't Work for PM Development
Most L&D organizations measure PM training the same way they measure any workshop: completion rates, satisfaction scores, and a post-session NPS survey.
The problem is not the measurement. The problem is what these metrics capture.
Completion rates measure attendance. A PM who completes a training module and returns to presenting feature roadmaps to executives has completed the training and missed the point.
Satisfaction scores measure how participants felt in the moment. 4.8 out of 5.0 is a vendor accountability metric. It does not tell you whether your PM team can now connect their product decisions to revenue.
Kirkpatrick Level 1 data (the standard post-session reaction survey) is what most vendors give you. It is the easiest data to collect. It is also the least useful to a CFO evaluating training spend.
The result: most PM training sits in a measurement blind spot. L&D buyers see value. CFOs see an undefended line item. The conversation goes badly, and the training budget gets cut.
◆
The Metrics That Survive the CFO Conversation
Promotion Velocity
Promotion velocity is the rate at which PMs advance after completing a development program. Specifically: the promotion rate of trained PM cohorts compared to untrained cohorts over a 12-month period.
Why it works in a budget conversation: promotion is a team-level outcome that connects directly to capability development, talent ROI, and retention cost avoidance. Your CFO already tracks promotion rates as a workforce health metric. Promotion velocity puts training ROI in a language the finance team already uses.
How to calculate it: count promotions within 12 months for trained cohorts, then compare to the untrained baseline. The delta is your promotion-velocity improvement.
Our proof point: 36 PM promotions in 12 months across coached cohorts. That is not a satisfaction score. That is headcount data the CFO already tracks.
A note on benchmarks: do not go looking for an industry promotion rate to compare yourself against. The published ones measure different populations with different definitions of what counts as a promotion, and none of them break out PM cohorts. Pave's 2024 analysis of 245,000 US tech employees put the overall rate at 14%, and it says plainly that company-wide figures mislead unless you split them by level. Your own trailing 12-month rate is the baseline that will hold up in the room.
Capability Coverage
Capability coverage is the percentage of a PM team that can connect their product work to a business outcome. Measured: what share of your PMs can answer "how does this sprint connect to our margin?" without needing a template.
Why it works: capability coverage is directly measurable through manager confirmation at 30 to 60 days post-program. It directly ties to strategic output quality. And it maps to the capability gap that shows up in exec reviews, budget presentations, and stakeholder escalations.
How to calculate it: run a pre/post capability assessment focused on the strategy and business acumen dimensions. Follow with manager behavioral surveys at 30 and 60 days that ask one question: "Is this PM now connecting product work to business outcomes without being asked?"
Our proof point: manager-confirmed behavioral change at 30 and 60 days post-program across 160+ PMs at a Big 4 firm. PMs shifted from presenting feature lists to presenting business cases. That client renewed and expanded. Framing for your CFO: "When your PMs start connecting product work to P&L outcomes without being prompted, your roadmap reviews change. Your exec presentations change. That is measurable."
◆
Reporting ROI With the Kirkpatrick Levels
The Kirkpatrick model gives you a ready-made structure for reporting training ROI across four levels of evidence. You do not need to build a custom framework. Map your PM training data to the four levels and you have a defensible CFO presentation.
Level 1 (Reaction): Collect post-session participant feedback. 4.8/5.0 is table stakes. Lead with it in your vendor accountability review. Do not lead with it in your CFO budget review.
Level 2 (Learning): Pre/post capability assessment. This is where capability coverage baseline data comes from. A program with no pre/post assessment is not designed to generate Level 2 evidence.
Level 3 (Behavior): Manager-confirmed behavioral change at 30 and 60 days post-program. The question to ask managers: "What observable behaviors have changed? Are PMs presenting business cases without being prompted? Have stakeholder escalations decreased? Are executive reviews improving?" Level 3 is where most vendors stop tracking. It is also where the CFO conversation starts getting defensible.
Level 4 (Results): Promotion velocity at 12 months and capability coverage at 60 days. These are the two data points that connect training investment to business impact. Promotion velocity connects to workforce ROI. Capability coverage connects to strategic output quality.
The structure you hand to your CFO: "Our Level 1 data is strong (4.8/5.0 across 160+ PMs). Level 2 shows measurable capability coverage improvement via pre/post assessment. Level 3 confirms manager-observed behavioral change at 30 and 60 days. Our Level 4 outcome (promotion-rate tracking) shows 36 promotions across prior program cohorts."
That presentation survives a CFO review.
◆
How to Build the PM Training Business Case
Here is a step-by-step framework that does not require proprietary tools. Use it before your next budget cycle.
Step 1: Define the gap in metric terms. What is your team's current capability coverage? How many of your PMs can connect their sprint to a P&L outcome today? What is your current promotion velocity? Count how many PMs advanced in the last 12 months, then compare it to the two years before that. These two numbers are the starting point. If you do not have them, a free capability diagnostic can generate your capability coverage baseline in 15 minutes.
Step 2: Calculate the cost of the gap. 4 hours per week per PM is a conservative estimate for time lost to misalignment, rework, and stakeholder friction in a delivery-only PM team. At a $150K median PM salary: 4 hours/week x 50 weeks x $72/hour = $14,400 per PM per year in misaligned effort. Across 10 PMs: $144,000 per year. That is the cost of the capability gap before you invest a dollar in training.
Step 3: Calculate program investment. Per-PM investment ranges from $625 (The Emerging PM, 12 hours over 2 weeks, up to 40 PMs) to $2,250 (The Influential PM, 20 hours over 4 weeks, up to 20 PMs). Customized enterprise engagements run higher. Program pricing is one-time. The capability coverage improvement compounds.
Step 4: Project ROI at three scenarios. Conservative (10% capability coverage improvement, no promotion velocity lift): 1 PM shifts from delivery to outcome-oriented. Estimated reduction in misalignment cost: $14,400. ROI: breakeven to 108% depending on cohort size.
Moderate (measurable capability coverage improvement with manager-confirmed behavioral change, 1 promotion in 12 months): 2 to 3 PMs shift. Retention cost avoided on 1 promotion (replacement cost: 0.5x to 2x annual salary). ROI: 300% to 500%.
Optimistic (strong capability coverage improvement, promotion velocity lift above your own trailing baseline): 3 to 4 PMs shift. 2 promotions in 12 months. Leadership visibility improves. Roadmap reviews move from feature lists to business cases. ROI: 700%+ (consistent with industry coaching ROI benchmarks).
Step 5: Define the pilot. The smallest test that generates Level 3 and Level 4 data: one cohort of 5 to 10 PMs, 4 to 8 weeks, with a pre/post assessment and a 60-day manager confirmation survey. Set your expansion threshold before the pilot starts: if capability coverage improves 15%+ and manager behavioral confirmation reaches 70%+ by day 60, expand to the full team.
Step 6: Attach the measurement plan to the budget request. Your budget request is not "we want to run PM training." It is "we are running a pilot to measure promotion velocity and capability coverage impact. Here is the measurement plan, here are the exit criteria for expansion, and here is what the projected ROI looks like at conservative, moderate, and optimistic scenarios." That framing separates your request from every other L&D line item.
◆
What a Big 4 Firm's Renewal Tells You About Training ROI
The firm's Assurance and Internal Technology practices trained 160+ product managers across multiple cohorts. They measured satisfaction (4.8/5.0 average). They also measured behavioral change and business impact.
The firm renewed and expanded the program.
Big 4 procurement teams are among the most rigorous in professional services. They do not renew vendor engagements based on satisfaction scores. They renew based on capability evidence and business impact data.
For any L&D buyer: a vendor renewal from an enterprise with high procurement standards is stronger evidence than any satisfaction score on a website. It means the measurement held up to scrutiny from a finance-aligned procurement team.
The question to ask any PM training vendor: "Who renewed, why did they renew, and can we talk to the decision-maker who approved the renewal?" If the vendor cannot answer all three parts of that question, they have not generated Level 4 data.
◆
Where to Start
A free 15-minute team diagnostic call generates your capability coverage baseline. You see where your PM team over-indexes on delivery and under-invests in strategy. You identify the highest-impact gap. And you get a Level 2 data point before any investment decision.
That capability coverage baseline is step one of the business case. It tells you the size of the gap. It gives you a number to put in front of your CFO before you've spent a dollar on training.
Related reading:
- What to Look for in Product Management Training for Teams (the 5 program design questions before you evaluate vendors)
- How to Evaluate PM Training Providers Without Getting Sold a Satisfaction Score (the 7-point checklist for vendor selection)
◆
Unabated Products builds PM capability programs that measure promotion velocity and capability coverage as standard outcomes. A Big 4 firm trained 160+ PMs across multiple cohorts and renewed. The program is available for enterprise teams via pilot engagement.
The Influential PM is a 3-week live cohort for B2B PMs who want to operate at the strategic level. Get the career results that follow.
Former VP of Product at a Big 4 firm. Has coached 500+ PMs across Fortune 500 companies. Teaches the Influential PM cohort on Maven.